


‘Dynamic load factor’ analysis is a fresh look at air capacity with benefits for all industry
- News Feed
- Friday, 07 February 2020
The Global utilisation of air cargo capacity is 35 per cent higher than the traditional industry indicator suggests, according to a new data services company offering a ‘dynamic load factor’ analysis.
It claims refreshing the way air cargo capacity use is measured to reflect modern day reality will strengthen the airlines’ voices with all stakeholders including airports, slot coordinators, legislators and aircraft manufacturers.
Clive Data Services claims air cargo load factors based on weight utilisation paint a misleading picture of how full flights really are.
“This is caused by the methodology used,” said Niall van de Wouw, managing director of Clive data Services.
“Traditionally, the amount of cargo flown in kgs is divided by the level of cargo capacity in kgs. But the reality for the vast majority of widebody and freighter flights is that it’s the cargo capacity in cubic metres that is the limiting factor, not the cargo capacity in kgs. Consequently, load factors based only on weight underestimate how full planes really are, 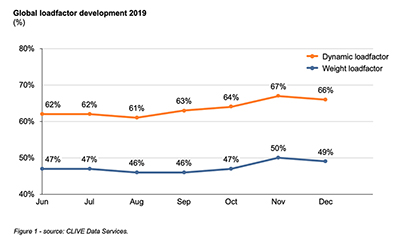 and thus give a distorted picture of how the industry is performing.
“The fact that flights nearly always ‘cube out’ before they ‘weigh out’ is a result of the aircraft’s higher capacity density (available kgs per cubic metre) than the average density of the goods moved by air. Looking ahead it is very likely that this discrepancy in capacity density and cargo density will further increase. On the capacity side, we have new planes entering the market that can lift more kgs of cargo per cubic metre than ever before. And, on the cargo side, the surge in e-commerce traffic will further decrease the average density of the cargo flown.”
Clive’s analysis shows the real utilisation of air cargo capacity on a global level is some 35 per cent higher than the traditional indicator suggests, he adds.
“We therefore believe it is time for a new yardstick: The dynamic load factor. To support this change in thinking, we will now be publishing a dynamic load factor analysis each month. It considers both the volume and the weight perspective of the cargo flown and capacity available. The analysis is based on flight data shared by a representative group of airlines operating to all corners of the globe. We believe this new yardstick will create a better understanding and more appreciation for the industry at regulatory and governmental levels.
“Going forward, in the first week of each month, we will be reporting an overview of the load factor trends for the previous month to ensure the industry has access to both the most accurate and most recent data,” de Wouw said.
The results of this new analysis will paint a more realistic picture of how air cargo capacity on a global level is being used (see figure 1 above).